TRENDS IN AVERAGE AND CLASS PER
CAPITA STANDARDS OF LIVING, 1939-1953
Vance Archive | Trotskyist Writers Index | ETOL Main Page
Permanent War Economy
THEORETICALLY, THE PROBLEM OF analyzing changes in the living standards of the major classes in capitalist society is not too difficult. All that is required is workable definitions, delimiting each of the major functional classes in terms of their relationship to the productive forces, together with a distribution of their respective claims upon the available supply of consumer goods and services. Statistically, however, we are confronted with the impossibility of measuring per capita standards of living by classes with any real degree of accuracy. Despite the libraries of statistical data relating to the economic system and its functioning, which are so voluminous that no single individual can hope to master all the sources of information in an ordinary lifetime, the unfortunate and highly significant fact is that the data collected and published are not designed to disclose the precise inner workings of an exploitative society. On the contrary, specific information may jeopardize the competitive position, real or fancied, of a firm or an industry or may penetrate the cloak of moral sanctity which a venal ruling class uses to justify many of its actions. There is, consequently, not only a running battle between industry and government over the types of reports necessary for policy formation, especially when economic, controls become mandatory, but also an inherent bias against the full truth in such data as are collected.
The choice, then, is one of halting our analysis of standards of living under the Permanent War Economy at a point where only classless conclusions can be reached, or of pioneering in an uncharted field in the hope that tentative conclusions will be helpful. We have chosen the latter course because there is sufficient empirical evidence that the impact of the Permanent War Economy has not been borne equally by all classes. “Equality of sacrifice” may be an attractive political slogan, but it is largely confined to pious resolutions. Consider, for example, this typical motivation for “equality of sacrifice” from the President’s Economic Message to Congress of January 12, 1951:
“It is essential that the sacrifices which are necessary in these critical times be shared fairly by all groups. Business men will be more cooperative in sacrificing peacetime profit objectives and paying more taxes, if it is clear that this is not being done just so farmers and workers can have more income.
“Farmers will be more cooperative in sacrificing peacetime farm income objectives, if it is clear that this is not being done just so workers can get more wages and business men can get more profits. Workers will be more cooperative in sacrificing peacetime wage objectives, if it is clear that this is not being done just to provide more profits for business or more farm income.
“Professional people, civil servants, office workers and those living on fixed incomes, will be willing to accept their share of necessary sacrifices, to the extent that it is clear that this is not being done just to provide for other people more profits or wages or farm income. All will be willing to make far more sacrifices for national defense and to keep our economy strong, if the burden is shared on a fair and equitable basis.”
The classless approach, plausible as it may appear to some, freezes all the inequities that existed at the beginning of the Permanent War Economy or of any specific mobilization, even assuming that the policy of “equality of sacrifice” is rigorously enforced. Just what the record has been and is likely to be becomes apparent only on the basis of a class analysis.
It must be emphasized that while the class data which follow are
experimental yet we believe that the broad conclusions which emerge
possess general validity.
OUR CLASS BREAKDOWN IS CONFINED to the four major economic classes, working classes, middle classes, farming classes, and bourgeoisie, each concealing within its fairly broad limits rather distinct income and class variations. The bourgeoisie covers the various sections of the capitalist class, that is those who own or control the production and distribution of commodities and services, other than farmers, whose substantial incomes are derived from capital, although in certain cases they may take the form of salaries as corporation officers or managers. It is this numerically inconsequential class of barely more than one per cent of the population that exercises effective control over the economy of the United States. The variation in personal income within the bourgeoisie is greater, percentagewise, than within any other class as it ranges from the moderately well-to-do receiving $20,000 a year to the millionaire and multi-millionaire.
The farming classes cover all those who live or work on farms, whose incomes, whether they be agricultural migratory laborers, tenant farmers, small independent farmers, or large commercial farmers organized as single entrepreneurs, cooperatives or corporations, are derived principally from agriculture. The class differentiations within this group are as obvious as the contrast between the Farmers Union and the Farm Bureau. Although the farming classes currently compromise almost 20 per cent of the population, the income variations are extreme, extending from the poor itinerant laborer and poverty-stricken self-sufficient farmer who barely see any cash at all during the year to the wealthy landowner in California’s lush Imperial Valley or other large-scale farm capitalist whose income and living standard are hardly distinguishable from the millionaire.
The middle classes are much harder to define, as at the lower limit they may overlap the working classes and at the upper limit the bourgeoisie. They include the small shopkeepers, the independent tradesmen and artisans, the independent professionals, and those salaried officials of government and private business who clearly belong to management, especially in relation to the power to hire and fire. Regarding salaried members of the middle classes, we have arbitrarily used as income limits to assist our functional analysis a range of $4,700 to $20,000 for 1948, the latest year for which family income distributions are available. In short, the bulk of single entrepreneurs and partnerships together with a minimum portion of salaried individuals in medium income brackets are numbered among the middle classes. Altogether, we currently place the middle classes at about 12 per cent of the population. If a strict income approach were to be used, the figure would be larger. The decisive criterion, however, is not income but relationship to production. All teachers and most government employees, for example, may think of themselves as middle class, but we have classified them as members of the working classes.
The working classes, consequently, compromise about two-thirds of the population and are much broader in scope than the factory proletariat. All those nonfarm workers who must sell their labor power in order to support themselves and their families, except for the relatively small portion of salaried employees included in the middle classes and the bourgeoisie, are subsumed under the heading “working classes.” In addition to factory wage earners, the overwhelming majority of white collar employees is considered to be part of the working classes. What may be interpreted as an upward bias in the size of the working classes is enhanced by our decision to place all the unemployed and their families in the working classes. This was done not so much for theoretical reasons, although it could be amply justified on these grounds alone, but for the very practical reason that there is no basis whatsoever for assigning any portion of the unemployed to the middle classes, in spite of the fact that members of the middle classes do experience unemployment from time to time and then find employment in a position enabling them to preserve their middle class status. Income variations among the working classes thus range from virtually zero to approximately $5,000 a year, with certain salaried individuals employed by government or organizations receiving considerably more.
Our broad functional, class approach corresponds to the relative fluidity of class lines in the United States. It is interesting to note that even the most patriotic classless appeals for national unity are constrained to recognize the existence of these broad economic classes. Having arrived at these definitions of the four major economic classes, it was then necessary to distribute the population, personal consumption expenditures and government nonwar purchases in accordance with our definitions. Distributing the population by classes did not present any insurmountable obstacles, as we begin with the existence of relatively good data on the farm population compiled by the Bureau of Agricultural Economics. The only significant manipulation required here was to allow for those members of the armed forces drawn from agriculture. The recent development of new series on the compensation of corporate officers, together with family income statistics and an arbitrary small percentage of the number of active proprietors of unincorporated enterprises, facilitated the derivation of the size of the bourgeoisie. The extent of the middle classes was based on the number of active non-agricultural proprietors, together with a portion of salaried employees adjusted for functional status and family income data. In effect, therefore, the calculation of the population of the working classes could be derived as a residual, except that the results were checked by using data on the number of non-agricultural employees together with fragmentary information on the number of employees per family and the number of individuals per family by income levels. We believe that the results are fairly consistent with our definitions.
To distribute personal consumption expenditures by clasres required a more elaborate technique starting with the relationship between total personal income and total personal consumption expenditures, the overall data, including projections, being shown in Table V.
|
Table V |
||||
|
Year |
Personal |
Personal |
Personal |
Personal |
|
1939 |
$72.6 |
$2.4 |
$2.7 |
$67.5 |
|
1940 |
78.3 |
2.6 |
3.6 |
72.1 |
|
1941 |
95. 3 |
3.3 |
9.7 |
82.3 |
|
1942 |
122.7 |
6.0 |
25.5 |
91.2 |
|
1943 |
150.3 |
17.9 |
30.2 |
102.2 |
|
1944 |
165.9 |
18.9 |
35.4 |
111.6 |
|
1945 |
171.9 |
20.9 |
27.9 |
123.1 |
|
1946 |
177.7 |
18.8 |
12.0 |
146.9 |
|
1947 |
191.0 |
21.5 |
3.9 |
165.6 |
|
1948 |
209.5 |
21.2 |
10.9 |
177.4 |
|
1949 |
206.1 |
18.7 |
8.6 |
178.8 |
|
1950† |
221.5 |
19.0 |
10.0 |
192.5 |
|
1951† |
236.3 |
22.0 |
25.0 |
189.3 |
|
1952† |
247.2 |
23.5 |
22.4 |
201.3 |
|
1953† |
248.7 |
24.5 |
24.1 |
200.1 |
|
* Identical with the series shown in Table II,
column one. |
||||
Personal income, as the name implies, delineates all income payments received by individuals and is presented by Commerce under these major heads: wage and salary receipts, other labor income, proprietors’ and rental income, dividends, personal interest income, and transfer payments. Certain types of income payments, such as net interest paid by government and transfer payments are excluded from national income and product. When personal tax and nontax payments by individuals to government, excluding purchases from government enterprises and consisting chiefly of personal income taxes, are subtracted from personal income the result is equal to disposable personal income which must either be spent or saved. Personal income minus personal tax and nontax payments minus personal savings therefore equals personal consumption expenditures, although the technique used by Commerce measures personal consumption expenditures independently and obtains personal savings as a residual. By analyzing the components of personal income separately, it was possible to break them down by classes in a manner consistent with the class distribution of the population. In certain cases, as foi example rent, the distribution is admittedly arbitrary, but the resulting pattern appears to be plausible. Limitations of space prevent us from showing any of the class derivations. The distribution of personal tax and nontax payments was weighted entirely by the distribution of individual income taxes, as revealed by Treasury data through 1946, an OPA study on Civilian Spending and Saving, 1941 and 1942, and selected TNEC data for 1939. Apportionment of personal savings was based on the aforementioned OPA and TNEC studies, a farm study by the Department of Agriculture for 1946 and, above all, a sample interview survey by the Federal Reserve Board showing the distribution of family liquid assets and savings in 1946 by income groups. We have no brief for the projections except that they seem to be reasonable. If there is any bias it is in the direction of minimizing personal taxes and savings of the working classes so as to maximize their personal consumption expenditures in order to set their standards of living at as high a level as possible.
Personal consumption expenditures by classes were then divided by the respective class populations in order to obtain per capita personal consumption expenditures by classes. To these results were then added per capita government nonwar purchases for the entire population on the assumption, already stated, that each person benefits equally from these contributions of government to the average standard of living. The maximum sum involved was $123 for 1949. The aggregate of per capita personal consumption expenditures by classes and per capita government nonwar purchases yields per capita standards of living by classes, the data for which in both current and constant dollars are presented in Table VI.
|
Table VI |
||||||||
|
|
Working Classes |
Farming Classes |
Middle Classes |
Bourgeoisie |
||||
|
Year |
Current |
1939 |
Current |
1939 |
Current |
1939 |
Current |
1939 |
|
1939 |
$596 |
$596 |
$295 |
$295 |
$635 |
$635 |
$7,546 |
$7,546 |
|
1940 |
617 |
608 |
301 |
297 |
679 |
670 |
7,847 |
7,739 |
|
1941 |
688 |
628 |
368 |
336 |
736 |
672 |
8,466 |
7,732 |
|
1942 |
723 |
589 |
402 |
328 |
736 |
600 |
8,828 |
7,195 |
|
1943 |
773 |
599 |
402 |
312 |
790 |
612 |
8,748 |
6,781 |
|
1944 |
825 |
632 |
430 |
329 |
862 |
660 |
9,317 |
7,134 |
|
1945 |
862 |
647 |
420 |
315 |
884 |
664 |
10,533 |
7,908 |
|
1946 |
875 |
589 |
546 |
367 |
1,215 |
818 |
14,981 |
10,081 |
|
1947 |
949 |
531 |
641 |
359 |
1,324 |
740 |
18,579 |
10,391 |
|
1948 |
1,066 |
552 |
802 |
415 |
1,559 |
807 |
20,442 |
10,586 |
|
1949 |
1,103 |
594 |
771 |
415 |
1,615 |
870 |
20,299 |
10,937 |
|
1950 |
1,139 |
588 |
779 |
402 |
1,619 |
836 |
21,384 |
11,040 |
|
1951 |
1,073 |
534 |
809 |
402 |
1,646 |
819 |
20,764 |
10,330 |
|
1952 |
1,136 |
557 |
842 |
413 |
1,708 |
837 |
21,546 |
10,562 |
|
1953 |
1,087 |
532 |
876 |
429 |
1,749 |
856 |
22,051 |
10,793 |
We have, of course, used the average price index developed in Table III to translate the current dollar figures into 1939 dollars, although a case can be made that the prices paid for commodities and services are not uniform in their rates of change for the various classes. Aside from the lack of evidence, it is unlikely that any attempt to adjust for such variations in price changes would materially affect the picture that emerges. Even in current dollars, the working classes have clearly lagged behind the rest of society. Merely on the basis of what has happened, as revealed by the increase in per capita standards of living in current dollars from 1939 to 1950, the myth of “equality of sacrifice” vanishes into thin air when confronted by facts. While the working classes were experiencing an increase from $596 to $1,139, a rise of 91 per cent, the middle classes went from $635 to $1,619, a rise of 155 per cent, the farming classes climbed from $295 to $779, a rise of 164 per cent, and the bourgeoisie soared from $7,546 to $21,384, a rise of 183 per cent. Now, as our data for 1951-1953 demonstrate, the disparity between the working classes and the other major classes will become even greater.
The gross average weekly earnings of production workers in
manufacturing industries of the BLS, commonly used to describe changes
in the status of the average worker, shows a rise from $23.86 in 1939
to about $59 in 1950, or an increase of 148 per cent. This is still
below the increase in consumption for other classes and it must be
remembered that “take-home” pay is a much better indicator of spending
power than gross earnings. It is probable, however, that the factory
proletariat enjoys a higher standard of living than most sections of
the working classes.
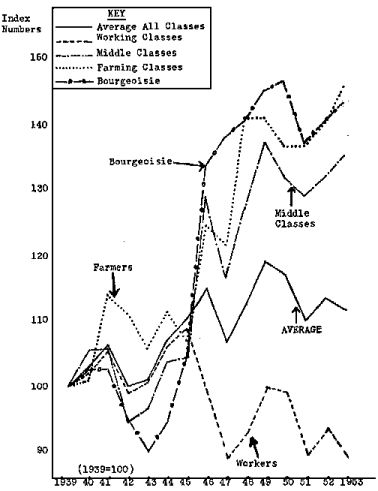
TO VIEW THE REAL IMPACT OF THE Permanent War Economy on the standards of living of the various classes, it is helpful to express the per capita data in 1939 dollars contained in Table VI as index numbers. This is done in Table VII and in the accompanying chart, which graphically shows the trends in average and class per capita standards of living.
|
Table VII |
|||||
|
Year |
Working |
Farming |
Middle |
Bourgeoisie |
Average |
|
1939 |
100.0 |
100.0 |
100.0 |
100.0 |
100.0 |
|
1940 |
102.0 |
100.7 |
105.5 |
102.6 |
102.7 |
|
1941 |
105.4 |
113.9 |
105.8 |
102.5 |
106.3 |
|
1942 |
98.8 |
111.2 |
94.5 |
95.3 |
100.0 |
|
1943 |
100.5 |
105.8 |
96.4 |
89.9 |
101.2 |
|
1944 |
106.0 |
111.5 |
103.9 |
94.5 |
107.0 |
|
1945 |
108.6 |
106.8 |
104.6 |
104.8 |
110.3 |
|
1946 |
98.8 |
124.3 |
128.8 |
133.6 |
114.7 |
|
1947 |
89.1 |
121.7 |
116.5 |
137.7 |
106.8 |
|
1948 |
92.6 |
140.7 |
127.1 |
140.3 |
112.5 |
|
1949 |
99.7 |
140.7 |
137.0 |
144.9 |
119.0 |
|
1950 |
98.7 |
136.3 |
131.7 |
146.3 |
117.0 |
|
1951 |
89.6 |
136.3 |
129.0 |
136.9 |
110.0 |
|
1952 |
93.5 |
140.0 |
131.8 |
140.0 |
113.5 |
|
1953 |
89.3 |
145.4 |
134.8 |
143.0 |
111.5 |
|
*Taken from Table IV, column six. |
|||||
|
|
TRENDS IN AVERAGE AND CLASS PER |
During the war there was a rough sort of equality among the classes, although it is clear that the farmers considerably improved their position. The rise in farm prices, aided by the preferred legislation successfully introduced by the farm bloc, made the farmers the one class whose standard of living exceeded the average. The workers roughly maintained their standard of living at the average level because of the rapid absorption of the unemployed as war outlays increased and the increased earnings due to overtime pay. The middle classes lagged slightly behind the average as many individual proprietors had to abandon their businesses due to the draft and the difficulty in obtaining supplies. The bourgeoisie lagged most, reaching their low point in 1943 when the first sharp increase in taxes took effect. In terms of comparative levels of living, however, the bourgeoisie maintained their overwhelming superiority over all other classes.
The year 1946 marked the transition from a period of relative freezing of class inequities to one where the working classes suffer both an absolute and relative decline in their living standards. From 1945 to 1946, as overtime ceased and unemployment increased with the termination of hostilities, the working classes underwent a decline of 9 per cent in their living standards, bringing them to a level below 1939. At the same time, as business opportunities expanded, the farming classes increased their living standards by 16 per cent, thus bringing them to a level 24 per cent above 1939 and more than compensating for any inequities that farmers may have experienced in 1939 due to their slow recovery from the depths of the depression; the middle classes augmented their living standards by 23 per cent, thereby rising to a level almost 29 per cent above 1939; and the bourgeoisie enhanced their already swollen living standards by 27 per cent, resulting in a level of living almost 34 per cent higher than in 1939. While these unprecedented divergent movements were taking place, the average per capita standard of living for all classes rose some 4 per cent, making the mythical average individual 15 per cent better off than in 1939.
The fate of working class living standards under the Permanent War Economy was irrevocably sealed in 1947, a year of unbridled inflation following the abandonment of price control with wages, contrary to most other forms of income, completely unable to keep pace with the rising cost of living. From 1946 to 1947, while the average standard of living for all classes declined almost 7 per cent, the working classes and middle classes experienced a catastrophic drop of almost 10 per cent and the farming classes experienced almost a 2 per cent decline but the bourgeoisie improved their position by 3 per cent. This meant that the average worker in 1947 was 11 per cent worse off than in 1939, but the average farmer was 22 per cent better off, the average member of the middle classes was 16.5 per cent better off, and the average member of the ruling class was 38 per cent better off. The fact that the average member of American society was 7 per cent better off was of little consolation to the workers who, as usual, bore the brunt of inflation.
Despite strike action and other attempts to improve their situation, the working classes could not show any significant recovery in their living standards by 1950. They still remained worse off than in 1939, while the farming classes were 36 per cent better off, the middle classes 32 per cent better off and the bourgeoisie 46 per cent better off, with the result that our mythical average American was 17 per cent better off. The fact that the average worker, including members of his family, received $1,139 worth of consumer goods and services in 1950 might indicate to the uninformed that the average member of the working classes enjoyed an extremely high standard of living. This is undoubtedly true compared with workers in other countries, but it is not true when compared with the situation of the average American worker in 1939 or of the average member of other classes. It is not even true that the average worker is better off than the average farmer, for in addition to the $779 that the average member of the farming classes received in 1950 he consumed a great many commodities raised on his farm that are not fully reflected in personal consumption expenditures. Certainly, the average member of the middle classes, who received more than $1,600 worth of consumer goods and services, was clearly in a better position than the average worker; and the average member of the bourgeoisie, whose consumption exceeded $21,000 in 1950, enjoyed such a luxurious standard of living that comparison with the average worker is like the position of a Stalinist or feudal lord contrasted with that of a modern or ancient serf. Now, as the ratio of war outlays to total output increases sharply and controls are introduced, we can expect all classes except farmers to undergo a decline in their living standards in 1951. While the average for all classes is expected to decline 6 per cent, the farming classes will hold their own, the middle classes will experience a 2 per cent decline, the bourgeoisie a decline of less than 7 per cent, and the working classes a decline exceeding 9 per cent. A slight improvement in 1952 should then be followed by a further attack on working class living standards in 1953. If our analysis is reasonably valid, and we believe that it is, the disparity between the working classes and other classes will be greater by 1953 than ever before in recent history. A deterioration of almost 11 per cent in the standard of living of the average worker from 1939 to 1953 will be accompanied by a more than 45 per cent improvement in the position of the average farmer, an almost 35 per cent betterment in the status of the average member of the middle classes, and a 43 per cent enrichment in the well-being of the average member of the bourgeoisie. For the working classes the fact that the average member of society will still be 11.5 per cent better off than in 1939 only makes more poignant the general law that as capital accumulates under the Permanent War Economy, there is both a relative and absolute decline in living standards.
There can be little doubt concerning the general picture of living standards shown by the chart. Following the end of the war the working classes have suffered substantially in comparison with all other major economic classes. Inasmuch as the present increase in the ratio of war outlays to total output is taking place at a time when there is relatively little room for further expansion of civilian and total output, the possibility of duplicating the rough equality of World War II is virtually non-existent. There must be a decline in average real standards of living and, under capitalist conditions, the working classes can expect to bear the brunt of this inevitable diversion of resources from civilian to war output. It is indeed a sad commentary on the functioning of a capitalist war economy that the working classes appear to achieve a “more just” share of such consumer goods and services as are produced under an all-out mobilization, when the ratio of war outlays to total output is between 40 and 45 per cent, than under a semi-mobilization, when the ratio of war outlays to total output runs between 20 and 25 per cent.
It is, of course, politically much easier to achieve rough equality
when there is very little to share than when more of the things that
make life pleasanter are available for distribution. This is virtually
a universal law applicable to all class societies. The situation in the
United States since 1939, however, has been complicated by a number of
factors whose impact, as the years unfold, is seen to be
disproportionately heavier on the working classes than on the other
major economic classes. We have reference to such elements in the
economic equation as the incidence of the growth in population, the
incidence of increased taxation, the concentration of net savings, the
unequal burdens imposed by the temporary disappearance of certain
consumer commodities from the market, the greater intensity of labor as
manpower shortages develop, and the peculiarly chronic character of
inflation under the Permanent War Economy.
AS HAS BEEN INDICATED, the growth in population from 1939 to 1953 has been sizable, amounting to 21 per cent. But Marx’s law concerning the polarization of classes has still been operating. Our tentative data reveal that for the fourteen years under analysis the farming classes will have experienced a decline of 3,600,000, more than enough to offset an increase of 2,000,000 among the middle classes and a growth of 500,000 in the bourgeoisie. Thus the size of the working classes will have expanded by 1,100,000 more than the increase in total population, or an augmentation of 29 million in the working classes. This is tantamount to a working class rate of growth of 35 per cent, with two-thirds of the increase occurring since the end of World War II, in large part due to the rapidly accelerating birthrate. Accordingly, we calculate the working classes as defined represented 63 per cent of the total population in 1939, but the proportion will have risen to 70 per cent by 1953! The pressure of increasing population is therefore almost exclusively in the direction of reducing the living standards of the working classes.
The incidence of taxation falls with increasing severity on the
working classes as taxes are increased. We exclude reference to
corporation taxes, for corporation profits after taxes have increased
far more rapidly than wages after taxes arid, in a good many, cases,
corporations have been able to pass higher taxes on to their customers
in the form of higher prices. Regarding solely personal tax and nontax
payments, the working classes paid less than 10 per cent of the total
prior to 1943. With the first big increase in the individual income
tax, accomplished more by a lowering of exemptions than an increase in
tax rates, the working classes immediately jumped to about 35 per cent
of total personal tax and nontax payments. Since 1943, the working
classes have borne from one-third to two-fifths of this burden.
Naturally, other classes have witnessed an increase in the amount
of their personal tax and nontax payments, but their personal incomes
have increased at a much faster pace than those of the working classes.
Thus, the increase in taxation rates for the non-working
classes has been relatively negligible. We shall return to this subject
at a later date, particularly in relation to the current drive to
impose a universal sales tax. That taxation, however, has been a potent
weapon in reducing the standards of living of the working classes is
beyond dispute.
SAVINGS OCCUPY A UNIQUE ROLE in any discussion of standards of living. Possession of sizable savings, for example, can readily lead to a higher rate of consumer expenditure than would otherwise take place. This, in turn, would lead to a higher standard of living and, more importantly, to a competitive bidding up of prices where goods are in short supply, thereby depriving those without savings of commodities they would normally be able to obtain if not for the existence of large savings in relatively few hands. The Federal Reserve study previously cited indicates that in 1946 79 per cent of all net savings occurred among those groups with $4,000 or more income. This would indicate that the working classes account for approximately 20 per cent of net savings.
It may be objected that 1946 is not a typical year, inasmuch as personal savings are estimated at only $12 billion, while in the peak year of 1944 personal savings exceeded $35 billion. As a matter of fact, for the fifteen years under consideration personal savings, as can be seen from Table V, are estimated to total $252 billion, an average of almost $17 billion annually in spite of the low levels of 1939-1941. Our estimates indicate that the working classes increase their personal savings very sharply when the decline in the supply of consumption goods is noticeable, and that for the entire period they account for 32 per cent of the total. Thus, two-thirds of the population are responsible for less than one-third of personal savings, while one-third of the population accumulates more than two-thirds of personal savings, a per capita differential against the working classes of more than four to one.
Although personal spending and savings habits vary widely, class differences are the decisive factor in explaining why the average non-worker saves four dollars for every dollar saved by the average worker. By and large, working class savings are fortuitous and temporary, as witness the current decline in the net volume of E bonds outstanding. This is not because workers lack a “sense of thrift” compared with other classes, but because they lack the opportunity to accumulate large savings. Low incomes are hardly conducive to high rates of savings. Given the widespread use of credit, the lower one’s income and therefore one’s savings, the more restricted is the opportunity to obtain credit. Conversely, a person with large savings is a better “risk” than one with little or no savings and therefore more apt to receive credit in any of its various forms. Savings, consequently, have both a psychological and indirect effect on living standards and cannot be entirely ignored in any appraisal of relative standards of living, especially among the major economic classes.
It is clear that no set of statistics can adequately measure the impact on living standards of the disappearance, or relative disappearance, of entire classes of commodities from the market due to the imposition of government controls. If an extreme situation be considered, such as during the war, when the production of certain consumer durables like automobiles, refrigerators, radios, etc., ceased as a result of governmental edict, it may at first glance be thought that the disparity among class living standards is reduced. The living standards of the bourgeoisie, for example, suffer greatly, while those of the working classes are barely affected. There is the rough equality of the ration card. There is also, however, the gross inequality of the black market where “money talks.” Likewise, the big hoarders can never be found among those whose incomes are too low to permit such unpatriotic actions, except on a very small scale. It is frequently stated that “anyone can buy anything for a price.” To the extent that this is true, it tends to offset the declines in the levels of living of the upper classes in a period of actual reduction or elimination of certain types of civilian output. Although it is not susceptible of statistical proof, we suspect that the absolute or relative disappearance of consumer commodities from the legitimate market creates a heavier burden on the standards of living of the working classes than of any other class.
The lengthening of the work week and the payment of premium rates
for overtime were important factors in explaining the rapid rise in the
personal income of the average worker during the war. There are other
methods, however, of increasing the intensity of labor. Speed-up can
and does take place, especially where assembly-line methods of
production prevail, and it is rarely accompanied by adequate
compensation. Again, we are in a field where statistics are conspicuous
by their absence. Nevertheless, it can be accepted as a universal law
that the greater the shortage of manpower, the greater the intensity of
labor. This is a burden that falls almost exclusively on the working
classes. It has a most important bearing on real standards of living,
for in a very real sense the capacity to enjoy leisure time is as
important a measure of true living standards as the ability to purchase
consumer goods and services. A worker whose leisure time has been
reduced or who is physically exhausted by an inhuman speed-up of the
assembly line and therefore in no position to enjoy such leisure time
as he may theoretically possess has suffered a decline in his standard
of living just as surely as if he experienced a reduction in his real
income. This entire problem, in turn, is related to incidence of
illness, length of productive working life, income at retirement, and
average longevity. There can be little doubt that all these factors
adversely affect working class living standards to a marked, if not
readily measurable, extent.
THE CHRONIC CHARACTER OF INFLATION under the Permanent War Economy is apparent to anyone with eyes to see. Whether the degree of inflation from 1939 to 1950 be measured by the Consumers’ Price Index, which shows a rise of 72 per cent, or the newly announced implicit price index affecting gross output of the Department of Commerce, which reveals a rise of 83 per cent (preliminary), or our own average price index, which displays a rise of 94 per cent, the fact remains that the price level has increased on the average by seven or eight per cent annually over the first eleven years of the Permanent War Economy. This rate of increase in the price level will continue to be maintained, regardless of controls, because inflation is unceasing and permanent. The higher the ratio of war outlays to total output, the greater the degree of inflation. There is no method under capitalism whereby the creation of purchasing power through waste (war) production can be so controlled and absorbed that inflation is eliminated. The value and therefore the price of civilian output is necessarily augmented as the war sector of the economy increases in size and scope. A worker in an aluminum plant, for example, must receive the same wage whether the product of his labor goes into pots and pans or bombers and fighter planes. In the former case, however, he can through the market exchange the labor time expended in the production of pots and pans for food, clothing and other commodities and services needed to provide subsistence and constant reproduction of the value of his labor power. This is possible only because pots and pans possess a use value to other workers. If, on the other hand, he is producing warplanes these are of no interest to the workers who produce food and clothing and, in fact, are not distributed through the market mechanism but by government direct purchase or requisition. The inflation is inevitable because munitions production does not satisfy human wants and therefore cannot contribute to the reproduction or the expansion of the variable portion of capital.
The most that controls can do under capitalism is to slow down the
rate of inflation and, if fairly devised and executed, distribute the
burden equitably among all classes. It is precisely in this regard,
however, that the naked class character of capitalism is most clearly
revealed. The per capita output of consumer goods and services from
both private and government sources, as was shown in Table VII, has
increased, but the living standards of the working classes have
declined. Inflation is one of the chief factors in the constant gnawing
away at the living standards of the working classes under the Permanent
War Economy. Just as taxes are designed to lighten the burden on
business, so are inflation controls geared to bear most heavily on
wages and to tread lightly on profits. By and large, the profits of the
bourgeoisie are in effect guaranteed by the state, while wages rapidly
depreciate under the full impact of inflation and controls – but this
is a subject for another article.
TO A MARXIST, OF COURSE, standards of living are a function of the rate of surplus value. If the living standards of the working classes have declined, both relatively and absolutely, then there must have been an increase in the rate of surplus value. That this has indeed been the case can readily be seen from Table VIII.
|
Table VIII |
|||
|
Year |
v |
s |
s/v |
|
1939 |
$43.3 |
$39.9 |
92% |
|
1940 |
46.7 |
46.3 |
99 |
|
1941 |
56.6 |
60.5 |
107 |
|
1942 |
72.3 |
79.3 |
110 |
|
1943 |
89.7 |
94.0 |
105 |
|
1944 |
98.8 |
103.0 |
104 |
|
1945 |
98.1 |
104.7 |
107 |
|
1946 |
92.6 |
106.3 |
115 |
|
1947 |
98.8 |
119.6 |
121 |
|
1948 |
105.4 |
136.3 |
129 |
|
1949 |
105.6 |
131.2 |
124 |
|
1950* |
115.0 |
142.0 |
123 |
|
1951* |
124.2 |
155.2 |
125 |
|
1952* |
129.9 |
163.4 |
126 |
|
1953* |
131.1 |
168.1 |
128 |
|
* Estimated |
|||
The absolute levels of surplus value and variable capital are necessarily tentative inasmuch as they are based on the class distribution of income data. Variable capital has been developed as the sum of wages and salaries of the working classes, wages and salaries of farm employees, other labor income (mainly employer contributions to private pension and welfare funds and compensation for injuries), employee contributions for social insurance, and employer contributions for social insurance. It will be noticed that the summation of variable capital and surplus value equals net national product in current dollars, as shown in Table I. In other words, on the theory that net national product actually represents the net value of current production or the total values created by labor power in the process of production, we have subtracted variable capital from net national product in order to obtain the magnitude of surplus value. The rate of surplus value is calculated as in Marx by dividing the mass of surplus value by the mass of variable capital.
The projections for employee and employer contributions for social insurance are arbitrary, although based on the anticipated effect of the revisions in the Social Security Act and our previously developed projections for the various income and output measures. These represent shares in current production even if they can only be spent in the future. A more serious objection to the simplified method used is the inherent assumption that the entire income of the non-working classes is derived from the surplus values created by the working classes, whereas it is clear that a portion of the income of some farmers, some single entrepreneurs and even some members of the bourgeoisie represents productive labor. It is felt, however, that this is substantially offset by the broad definition of the working classes, which includes many unproductive workers (in the Marxian sense), such as government employees, certain types of white collar workers as salesmen, insurance agents, etc., the unemployed and retired workers. Moreover, the bourgeoisie and middle classes are heavy beneficiaries of employer contributions to private pension and welfare funds.
The calculated amount of surplus value appears to be reasonable and the rate of surplus value coincides with everyday observation and what one would expect to find from a more detailed study. Even if exception be taken to the magnitudes of s and v, the rising trend in the rate of surplus value is clearly established. From 1939 to 1953, the rate of surplus value will have increased almost 40 per cent. Eschewing our projections, this sizable increase in the rate of exploitation was already reached by 1948. It is only since then, and belatedly, that the trade union movement has made some slight progress in reducing the rate of surplus value. The conclusion is inescapable that the enormous growth in the productivity of labor since 1939 has not redounded to the benefit of the working classes.
The rise in the rate of surplus value from 92 per cent in 1939 to 129 per cent in 1948 and to an estimated 123 per cent in 1950 provides an incontestable refutation to the puerile argument of the apologists for the status quo that “labor has fared as well as anyone else, for wages and salaries remain fairly constant at about two-thirds of the national income.” What these gentlemen conveniently overlook is the fact that wages and salaries constitutes a completely misleading income classification, concealing within its broad cover the six-digit salaries of corporation executives, Hollywood actors and leading public entertainers, not to mention the salaries of all types of people in managerial and semi-managerial positions. To lump together the salary of a Charles E. Wilson (General Motors or General Electric) with the $50 or $65 weekly wage of a typical factory worker is simply to render impossible any type of scientific analysis concerning standards of living or the real workings of the economic system. And the evidence is clear that compensation of corporate officers, for example, has increased faster than the wages and salaries of other corporation employees.
It is no longer possible to arrive at an approximation of the magnitude of surplus value, as Marx did, by adding the shares of income admittedly paid out in the form of profits, interest, rent and royalties. It is equally necessary to include a large portion of wages and salaries, representing currently at least all salaries in excess of $10,000 annually. Such an adjustment, obviously required if the true position of the working classes is to be realistically examined, results in an increase in the mass of surplus value of about one-third and almost doubles the rate of surplus value!
Reducing the rate of surplus value does not arrest inflation, but it would help to make the burdens of inflation and declining standards of living more equitable. These are the immediate and central tasks of the working classes on the economic front. The longer they are delayed the more likely is the new environment of the Permanent War Economy to entrench itself and to condemn the mass of humanity to an existence devoid of hope for escape from the threats or reality of misery, war and totalitarianism.
|
January 1951 |
Permanent War Economy
Vance Archive | Trotskyist Writers Index | ETOL Main Page
Last updated: 19.8.2005