From Socialist Review, No.10, March 1979, pp.34-39.
Transcribed & marked up by Einde O’Callaghan for the Marxists’ Internet Archive.
|
Chris Harman acts as guide through the jungle of economic facts and arguments about whether wages cause inflation. |
In the current arguments about wages policy, government apologists return again and again to a single theme: rising wages are responsible for rising prices. There are a number of simple counterarguments used – quite correctly – by militants:
1) If rising wages are the cause of the levels of inflation we have experienced in recent years, why was it that living standards could rise in the 1950s year in, year out, without inflation getting out of control?
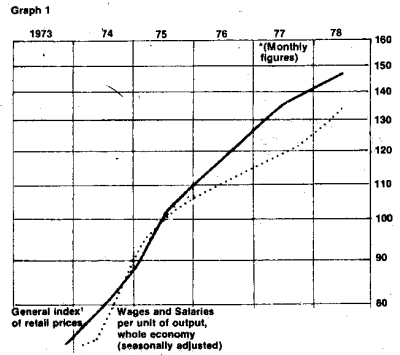
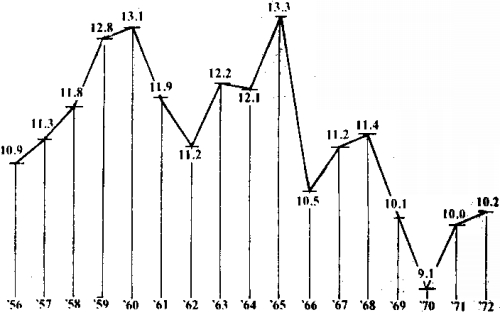
2) Far from wages surging ahead of inflation, in the period since 1973 prices have kept well ahead of wages for most of the time. Only for about eight months in 1974-5 out of a total period of six years have wage costs to industry, as measured by ‘wages and salaries per unit of output for the whole economy’, been ahead of prices. By spring of last year, while prices were 50 per cent above their 1975 level, wages costs had only risen by 30 per cent (figures from Economic Trends). (See Graph 1).
| |
Real take home pay was still lower last year than it was in 1972.
The year of the highest inflation in living memory – 1975 – was a year in which real net income for a married couple with two children fell by £2.90 (at Oct 1978 prices).
|
Real weekly net income at October 1978 prices: |
||||
|---|---|---|---|---|
|
|
|
single person |
|
married couple |
|
September 1970 |
£62.20 |
£68.90 |
||
|
September 1972 |
£65.90 |
£74.50 |
||
|
September 1977 |
£59.10 |
£68.10 |
||
|
September 1978 |
£64.40 |
£73.80 |
||
3) Prices are continually rising for reasons that clearly have nothing to do with wages. Shortly before Christmas, the government raised the minimum lending rate, inevitably forcing up the cost to councils of borrowing money and therefore putting pressure on rents and rates.
That was nothing to do with ‘wage push’.
Again, the succession of food price rises agreed between the EEC governments have not gone to increase the pay of farm workers (which has lagged behind the cost of living like other workers’ wages) but to increase the incomes of their employers. The last few months have seen a world-wide upsurge in commodity prices and a rise in the price of oil – both of which will increase raw material costs and therefore prices – regardless of what happens to wages.
The following tables shows the extent to which non-wage factors have pushed up prices over the years:
[ Financial Times, Dec ’76 ] |
However, the simple arguments against the idea that wages cause inflation are apparently refuted by a different set of figures which show the share of profits in the national income.
It is claimed that the share of profits has been falling for the last 20 years: that the decline is caused by a growth of the share of the national income going to workers: that the result has been a decline in the rate of profit, until there is no longer any incentive for capitalists to invest: and that this explains a characteristic feature of the crisis, the combination of stagnation and inflation.
According to such a view, inflation is due to the fact that workers have been winning the battle between labour and capital over the distribution of the national cake.
There is a right-wing version of this explanation put forward by apologists for the system: they conclude that if only the ‘power of the unions’ could be broken and the ‘share of capital’ restored, the system would pull out of the crisis.
But some socialists accept the same analysis for example the Oxford economists Glyn and Sutcliffe in their book British Capitalism. Workers and the Profits Squeeze. Using the same figures as the right. they say that rather than try to make the system work by accepting a smaller share, workers should ‘fight to overthrow the system.
However, even the ‘left wing’ version has implications which serve to weaken workers’ struggles. If it were correct, it would seem that when Callaghan and co say that ‘sacrifice’ will pull the system out of crisis, they are right. And for most workers, ‘sacrifice’ seems a more ‘realistic’ option than socialist revolution.
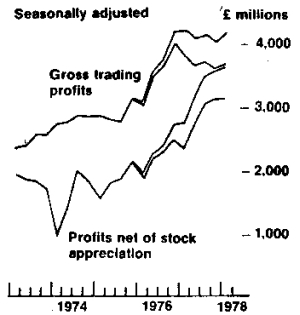
The facts of declining profitabilityThere is no doubt at all that the rate of profit in British industry has been falling. All the different ways of measuring profitability, display roughly the same trend. (All figures are from the Bank of England Quarterly, 1976 and 1978)
The pretax rate of return at historic costsThis is the measure of profits that was generally used until the mid-1970s. It shows a decline from an average figure of over 16 per cent in the early 1960s to about 13 per cent in the late 1960s. However, it indicates a recovery of profits in the years 1972 - 4. The pretax rate of profit after excluding stock appreciationThe recovery of historic-cost company profits in the mid-1970s was very much due to the fuel that inflation rapidly increased the value of the stocks of goods and raw materials in capitalists’ possession. But it has been argued (see, for instance, Glyn and Sutcliffe) that this increase was not real profit, since it had to be used to replace components and raw materials at higher prices. In the last few years accountants have tried to devise methods of profit-calculation that excludes this factor of ‘stock appreciation’. From the point of view of capital, that is logical since what it is concerned with is the level of profit left over at the end of the year for accumulation or consumption by the capitalist class. From the workers’ point of view, however, increased expenditure on stocks is a charge on the value they produce that then passes into the control of the capitalist class. For them, historic-cost calculations give a better picture of how the product of their labour is divided between labour and capital. Since we are concerned with the effects of declining profitability on the capitalist system, that system’s measure of profits is the most useful one here. After deducting stock appreciation, the rate of profit declined through the early 1970s as well as through the 1960s – from around 13 per cent in the mid-1960s to nine per cent in 1975. before rising to 12 percent during the first year of the social-contract wage controls. 1976. The pre-tax ‘real rate of return’The final measure of pre-tax profits excludes, as well as stock appreciation, the rising cost to capitalists of putting aside funds to replace capital equipment as inflation raises its price. The difficulty with this measure is that companies have every incentive to exaggerate the cost of replacing equipment, since they get tax exemptions of such expenditure and since it is very difficult to tell from the outside whether what occurs is simple replacement or the introduction of larger and more modern equipment. Nevertheless, the figures to throw some light on profitability, indicating a dramatic decline from 12 per cent in 1961 to nine percent in 1971 to four percent in 1975. then rising with the social contract in 1976 to 4.7 per cent. The after-tax ‘real’ rate of returnAfter tax the picture for profitability is rather different in the early 1960s, since there was a shift in taxation from companies to wage and salary earners. The post-tax rate of return ‘fluctuates around 7-9 per cent in the early 1960s. But thereafter it follows the pre-tax rate of return ... By the end of thedecadethe post-tax return had reached about 3½ per cent’ (Andrew Glyn in Bulletin of the Conference of Socialist Economists, February 1975). Thereafter it fell below zero 1974. hut has risen again to about four per cent since. |
The analysis shared by most apologists for the system as well as Glyn and Sutcliffe offers a very simple explanation for the decline in profitability.
They give figures alleging that the share of labour in the national income has been rising, and claim that this has caused a fall in the share of profits and therefore in the rate of profit. Certainly, at first sight, the share of capital seems to have fallen.
The Bank of England Quarterly Bulletin, for instance, shows the share of ‘historic profits’ as falling from 16-18 per cent in the 1940s and 1950s to 15-16 per cent in the 1960s to 12-13 per cent in the mid 1970s. And ‘real’ profits are shown as falling from 14-15 per cent of the national income right down to 4-6 per cent.
The Bank of England Quarterly Bulletin itself is quite cautious about what these figures signify. It says that ‘the decline in the share of profits ... may reflect ... a growth of union bargaining power’. There was no such caution in Glyn and Sutcliffe’s book. For them the ‘decline in the share of profits’ could only result from a rise in the share of labour.
In their book they attempted to show this with figures giving the proportion of ‘wages and salaries’ in the national income and in company turnover.
These figures were always open to question, since although some salaries are a form of remuneration of labour, others (e.g. payments to management) are a disguised distribution of profit. In the latter case, salaries can rise without the ‘share of labour’ increasing at all.
But there is a second, more devastating objection to the figures. They take no account of the fact that the tax system has changed over the last 25 years, so that taxation on wages salaries has risen dramatically, while taxation on profits has fallen to virtually zero.
|
The proportion of the national income, after tax, |
 |
Glyn had the honesty to admit this in an article he wrote in 1975 (unfortunately, the article had much less publicity than the earlier book). Nevertheless, he tried to maintain part of his original explanation, by claiming that the share of profit in the national income has also fallen. After tax it remained steady until about 1964.
‘Thereafter the fall in the pre-tax share was no longer compensated for by cuts in taxation ... So the five year average of the post-tax share falls from more than 20 per cent in 1966 to less than 15 per cent in 1970’.
But this was a period in which not only was taxation on companies falling, but there was also an increase in the funds handed out to companies by government. When that change is taken into consideration, the share of capital in the national income remains fairly steady between 1956 and 1972, rising from about 11 to about 12 per cent in the early 1960s and then falling back to about 10 per cent at the beginning of the 1970s.
|
All Companies’ UK income, less stock appreciation capital consumption and taxes on income and capital, plus investment grants – as share of national income |
[ G.J. Burgess and A.J. Webb, Lloyd’s Bank Review 1974] |
The figures we have just given do not quite end the argument. For, there remains the question of where the money taken from workers and from capital for taxes goes. There is a widespread myth that they are returned to the poorer section of the population as a ‘social wage’, that redistributes income from capital to labour.
A whole ideology has developed about government spending ‘squeezing out’ profitable, ‘productive’ industry. Even the socialist Glyn suggested in 1975 (in the article quoted earlier) that once that portion of government spending going to workers was taken into account, the share of labour in the national income had been rising fast enough to provoke a crisis for British capitalism.
He began, quite correctly, by insisting that a large portion of public expenditure did not go to workers at all, but was spent exclusively in the interests of capital: defence and law and order were designed to protect capitalist property (against workers and against foreign capitalists); most of expenditure on roads was designed to allow quicker movement of goods traffic; ‘industry and trade’, ‘agriculture’ and interest on the national debt all represented payments from the government to capital.
However, Glyn then went on to make a calculation that exaggerated the proportion of government spending going to workers; He suggested that the workers’ share amounted to
‘92.5 per cent of current expenditure on housing, health, education and other social services; half expenditure on fire services: a quarter of expenditure on roads: plus current grants to persons (net of tax) and consumption of social service means of production’.
Using these proportions, he finds that
‘far from there being a fall in the share of the net social product going to labour, there has been a rise, from 69.3 percent in 1955 to 73.7 per cent in 1972’.
But the proportions are open to two sorts of powerful objections. First, they overstate the proportion of services such as social security, the NHS, housing and education going to workers. ‘Current grants to persons’ include grants to unemployed and retired members of the petty bourgeoisie. Family allowances go to them and to the bourgeoisie as much as to workers.
A number of studies indicate that these classes get a greater proportion of services per head from the Health Service than do workers (according to Social Trends the top ten per cent of households got an average of £287 worth of service a year from the NHS in 1976, while the average household got only £225 – indeed, the top ten per cent even did better on welfare foods, getting £19 worth a year, compared with the average of £16!).
And when it comes to one of the fastest areas of spending growth in the 1950s and 1960s, education, you find that the bulk of this growth was in sectors of education where the number of students from the working class was 50 per cent or less!
Between 1951 and 1969 expenditure on primary education (where the majority of children are working-class) grew by only £294 million – no faster than the growth in the national income. By contrast, spending on higher education, where the majority of beneficiaries come from non-working-class background, rose by £569m.
The predominantly working class primary school child cost the state £91 a year in 1968-9; the predominantly working-class 11-16 year old £171 a year; by contrast the nearly half ‘professional and managerial’ 16-18 year old cost £303 a year, and the predominantly non-working-class higher education student £1200 a year. On these figures, much less than 92.5 per cent of educational expenditure can have been said to have benefited working-class children.
If we take these objections into account and use different calculations to Glyn’s (assuming that workers get 90 per cent of the benefits of social security payments, 75 per cent of NHS services, 90 percent of housing expenditure and a share of educational expenditure falling from 60 per cent in the early 1950s to 50 per cent in the late 1960s). we get figures that indicate that the workers’ share of the total national product could not have risen by more than about two per cent in 18 years.
And even this calculation probably exaggerates the workers’ share. For it is possible to argue that educational expenditure is not in any real sense something that adds to the workers consumption, in the same way that family allowances or a free health service does. Workers are compelled by law to send their children to school, for the very simple reason that capitalism needs a future labour force with certain basic skills and certain patterns of discipline.
Even though most workers like the idea of their children getting a ‘decent education’ it cannot be regarded as part of their family consumption or of their ‘social wage’.
Expenditure on education is expenditure shaped to suit the needs of international capitalist competition, not the desires of workers. If it is excluded from calculations on the ‘social wage’, you find that the workers’ share of the social product falls by about two per cent between the early 1950s and the end of the 1960s, rather than rising.
If any squeeze in the share of profits in the national product cannot be explained in terms of a greater share going to labour, what does explain it?
At least part of the explanation lies in the way in which in the 1960s and 1970s the needs of capital have demanded greater government expenditure.
Although there was a decline in the level of arms spending (from about 22 per cent of government spending in the early 1950s to about 15 per cent by the late sixties) there was a rise in the share of roads, law and order, education, aid to industry and the servicing of the national debt. Increasing international competition demanded a greater attention to the needs of capital by the state, which meant a growing tax burden that capital tried to put on the shoulders of labour.
While British capitalism was expanding during the 1950s and early 1960s, it could afford increased government expenditure. It was the economic crisis of the 1970s that made this burden too great. The share of public expenditure in the national product actually fell after the Korean war: it then rose slowly until 1966-7. when it shot upwards as the then Labour government imposed a credit squeeze that cut the rate of growth and boosted unemployment by 50 per cent; after a slight decline it rose very slowly until it shot up again with the economic crisis of 1974-6. until the public expenditure cuts reduced the level.
This growing crisis also explains both the increased need for the state to service capital, and the greater burden that it represents. It also explains much of the rise in so-called ‘social wage’ element of public spending. The fastest single growth item has been social security payments – reflecting not any great growth in the value to the individual recipient, but the growing number of workers made unemployed by the crisis, as well as the near, doubling of the number of old-age pensioners over the last 25 years.
If government expenditure became a burden for the system in the mid-1970s, this was not in itself the cause of the crisis. Still less was a ‘massive social wage’ the cause. Rather government expenditure seemed too great for the system to bear and the ‘social wage’ seemed excessive because a more basic crisis increased the demands on government expenditure while cutting back the total national product.
None of that, of course, prevented the Labour government from responding to the crisis by cutting back precisely on those elements in public expenditure that did. in a real sense, benefit workers. Neither wages nor the social wage caused the crisis of profitability; but both could be cut in a desperate attempt to overcome it.
There is an explanation of the fall in the rate of profit which does not depend upon the assumption of a growing share of the national product going to workers. This is the classic marxist view that the accumulation of capital itself leads to a fall in the rate of profit, even if total profit increases.
This is because. Marx claimed, accumulation would tend to mean that investment got ever more capital-intensive, with the total investment in means of production growing more quickly than the labour employed (in Marx’s terminology, ‘the organic composition of capital’ rises) Since, according to the marxist analysis, it is labour which is the origin of value and surplus value, that means that surplus-value grows less quickly than investment. The ratio of surplus-value to total investment is the rate of profit, and this will fall.
It has been fashionable among academic marxists and near marxists to be disparaging about this part of Marx’s theory in recent years. A leading ‘socialist’ opponent of the labour theory of value. Ian Steedman, wrote in the New Statesman recently that virtually no reputable marxists now take the theory seriously. And he is partly right: whole schools of ‘marxist’ economists dismiss the trend to a falling rate of profit, or see it as only a trend interacting with equally powerful counter-trends. On that analysis, if the rate of profit falls, it can only be because of a rising share of wages.
Steedman has gone as far as to claim that it is impossible for new capital investment to lead to a fall in the rate of profit. He alleges that an increase in the capital-labour ratio must lead to a rise in the rate of profit. And. even thinkers who are closer to Marx’s own thought, like Sue Himmelweit. and John Harrison produced alleged proofs of this same thing.
Yet since then empirical evidence has emerged which suggest that there is a, connection between a rising ratio of capital to labour and the falling rate of profit.
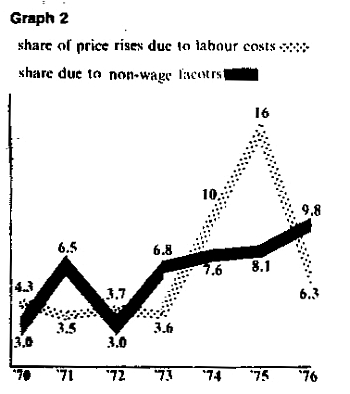
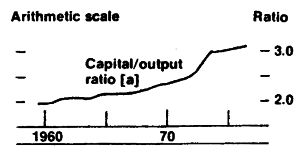
One of the things the Bank of England Quarterly Bulletin looked at was the capital-output ratio (how much investment it takes to produce a particular quanitity of goods). It showed that it ‘grew fairly steadily between the early 1960s and the 1970s (from about 2 to about 2½). In the 1970s it has grown further to about 3’ (see Graph 3) – although here, they note, the crisis itself, by increasing the level of unused manufacturing capacity will exaggerate the real figures. It suggested that ‘these changes in the capital output ratio meant that the downward trend in the real rate of return on capital from 1960 to 1973, and the more dramatic fall since, have been much more marked than the decline of real profits in company value added’ (1978, p.517).
|
Graph 3 |
 |
The economist Colin Clark showed in an article in Lloyds Bank Review in 1975 the way in which each rise in the capital-output ratio has been accompanied by a fall in the rate of profit (see Graph 2). Clark also suggests that a similar process has been at work in Australia, and in the US from the mid-1960s.
Samuel Brittain of the Financial Times, another bourgeois economist, has noted the same trend with bewilderment.
‘There has been an underlying long term decline in the amount of output per unit of capital in manufacturing ... This is a fairly general experience in the industrial countries ... One can construct a fairly plausible story to explain this for any one country: but not for the industrial world as a whole.’ [Financial Times, 3 March 1977]
For an explanation Britain would have to drop adherence to the theories of Milton Friedman and turn to Karl Marx.
|
How the rate of profit falls |
|---|
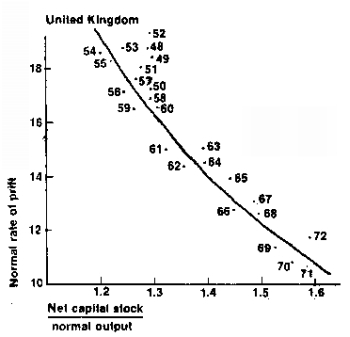
(From C. Clarke in Lloyd’s Bank Review, October ’74) |
The capital-output ratio will normally show the same trend as the marxist category of the organic composition of capital (i.e. – unless there is a dramatic increase in the rate of exploitation of workers – which no one claims for the last 25 years – c/v+s will show the same trend as c/v). The rate of profit is falling as the organic composition of capital rises, because of the dynamic of the accumulation process itself. Bourgeois empiricism seems to come to conclusions that bear out Marx, even though academics who purport to ‘refine’ Marx insist such conclusions are ‘theoretically impossible’.
‘It is worth adding that one of those on the left to first see the ‘rising share of labour’ as the cause of the crisis, Glyn, does admit (in his 1975 article) that because the capital-output ratio ‘for the company sector as a whole has been rising since the fifties ... the rate of profit fell faster than the share of profit’.
In fact, the evidence of the rising capital-output ratio leads to an explanation of the unending trend to inflation quite different from that of the myth of a rising ‘workers share’. The causes of inflation can be seen as lying in the inner structure of an economic system that has outlived its time, and not in the ‘wage push’ of workers. The very success of capitalism in accumulating gives rise to the fall in the capital-output ratio. This leads to a tendency for the rate of profit to fall, even if the share of capital in the national product rises.
How does capital, react when this happens? Classically, there were two different responses, depending upon whether the system was booming, or whether it was entering into recession.
In a boom, capitalists felt confident that their goods would sell, even if they increased their prices. So when profit was threatened by rising costs, they raised prices to try to protect themselves. Once certain goods had increased in price, other capitalists raised their prices so as to maintain their profits after paying for those goods. Workers too pushed for higher wages so as to protect their living standards. An inflationary spiral developed, very much like that we see today.
Except that the inflationary spiral came to an end once the boom came to an end.
Once the recession set in. capitalists had to respond to the pressure on their profits in a different way. Contracting markets meant they could not sell goods at existing prices let alone at prices that were raised in an effort to protect profits. They had to slash prices, and then enforce even greater wage cuts on their workers if profits were not to disappear.
As the crisis drove whole firms out of business, prices tumbled still further. Their goods and equipment could be bought up at rock bottom prices by other firms, so enabling their profits to recover despite the low general level of prices. And rising unemployment reduced the ability of workers to resist wage-cuts.
So the system passed from an inflationary period, as profit rates were first threatened during the boom, to a period of falling prices (or, in current government parlance, a ‘counter-inflationary’ period) as the crisis fully hit the system.
It only needs to be added, that the crisis itself created the preconditions for a new boom with reduced inflationary pressures at first. The extremely low prices at which equipment from bankrupt firms could be obtained meant that the cost of new investment fell, and with it the capital-labour ratio. To use marxist terminology: the crisis led to a destruction of capital values, to a devaluation of capital, and lowered the organic composition of capital in value terms.
However, as capitalism has grown old. there has been a seizing up of the mechanisms which previously meant a fall in prices during a crisis, and a lowering of the organic composition of capital.
The ageing of capitalism has been accompanied by a growing domination of each national market by a small number of firms. Mergers and takeovers have increased the size of individual firms until in Britain in 1970 the top 100 firms controlled 40 per cent of the total market, and in the US in 1976 the top 200 companies controlled 58.8 per cent of the market.
Once the market is dominated by a relatively small number of large firms, they are capable, of arranging things among themselves so that their response to a crisis is not to cut prices, but to carve up he market between each other, to all continue in operation, but at reduced capacity, and to raise prices so as to pay for the increased overheads this brings about.
Even the former head of the Price Commission, Lord Cockfield, has been able to comment that
‘We suffer in this country from market domination, price leadership, parallel pricing, the lack of effective competition, unwillingness to compete on price, and a cost-plus mentality’, (quoted in Financial Times, 6 February 1979).
In such a situation prices are raised to protect profit rates in the slump as well as in the boom.
The American radical economist Sherman has analysed how the changeover from ‘slump = falling prices’ to ‘slump = rising prices’ took place. He points out that ‘in almost all recessions and depressions up to the recession of 1948. prices fell ... In the recession of 1948, prices in the competitive (i.e. non-monopoly – CH) industries fell by 7.8 per cent. But the prices of monopoly industries fell by only 1.9 per cent ...
‘Since that time the competitive (i.e. non-monopoly) prices has fallen in each recession, but the monopoly prices have risen in each recession. Hence the prices in the US industries in which fewer than eight firms controlled more than 50 per cent of the market rose by 1.9 per cent in the 1953 recession, by 0.5 per cent in the 1958 recession and by 5.9 per cent in the 1969 recession’ (Review of Radical Political Economy, Summer 1976).
The consequence is that once inflation starts in the system, it is very difficult to bring it to an end.
This was shown clearly in the US in the early 1970s. The inflation created by the second world war and by the Korean war had soon disappeared from the system. Not so the inflation caused by spending on the Vietnam War:
‘Unemployment continued to decline in 1969 and consumer prices rose ... When demand finally fell and unemployment rose in the recession of 1970, the inflation rate hardly budged.’ (C.L. Perry, Brooking Papers on Economic Activity, 1978. No.2).
It required government intervention to achieve what the old mechanisms could no longer achieve and even they could only work for a brief period.
‘In the summer of 1971, the Nixon administration imposed wage and price controls that lasted, in a modified form, until April 1974. These controls slowed the inflation rate for most wages and prices. But by the time the controls expired, higher prices for food and fuel ... and for industrial raw materials ... had created double digit rates of overall inflation ...’
The story was repeated in the most recent recession. The
‘recession was double the size of the average post-war recession ... By the end of the recession inflation had slowed sharply from its 1974 peak, but further improvement was slight once recovery began ... The rate of inflation has continued at a historically high rate, and now shows signs of creeping still further up’. (ibid.)
The growth in the size of firms has destroyed the mechanism the system used to have for flushing out inflation. Inflation is not caused by ‘wage-push’, but is one of the characteristic features of ageing capitalism.
The domination of the national economy by a few very large firms also has another consequence for the system. No-one in the capitalist class is prepared seriously to countenance any of the major firms going bankrupt: the effect on the rest of the economy would be just too devastating. So there is an end to the old mechanism tor reducing the cost of investment by some firms collapsing and other more efficient firms buy up their stocks and equipment on the cheap. Instead, the government invariably steps in to bail firms out.
The result is that there is no significant cheapening of investment in the slump: the ratio of capital to labour does not fall: there is no counter-tendency to slow down the pressure on profit rates: once a new boom begins to set in, the firms feel a greater need than ever to raise prices so as to counteract this pressure.
The inability of the system to drive to the wail the largest firms also explains something else about modern inflation. The currently fashionable school of right-wing ‘monetarist’ economists are partially correct when they say that there could be no inflation if governments did not allow the amount of money in the economy to grow. What they don’t explain, however, is why the money supply always does grow, even if former monetarists get control of the switches on the machines that print banknotes.
Yet the reason is simple enough: to stop the expansion of the money supply is to deny to firms the possibility of inflating their prices so as to counter pressures on profitability. But that is to threaten huge chunks of the national economy with bankruptcy. When it comes to it, the heads of the giant firms have enough political influence to stop that happening.
First, the fact that the inflationary pressures originate in attempts to protect profit rates does nof mean that they end there. Once one group of capitalists raise their prices, other groups of capitalists who use their products as in-puts will tend to raise their prices as well. And workers (unless held down by wages policy) will try to protect their living standard by forcing higher wages.
These rises in turn cut into the profits of the first group of capitalists, until they are back where they started. Their drive for profitability gives the spiral its first push, but it soon comes round and hits them as well as everyone else, driving them to further push up their prices again in the interests of profitability.
The drive for profitability is not the only thing that can give the inflationary spiral a shove. Relatively accidental things like wars and harvest failures can play a part. So can the attempt of workers to recuperate through wage claims what they have lost in years of wage controls. But none of these things would, in themselves, cause sustained inflationary trends were it not for the inbuilt features of the ageing capitalist system the growing ratio of capital to labour, and the ability of the giant firms to protect themselves from competitive pressures during a recession.
This argument can be put another way: If workers simply accepted that their wages should not rise with prices, then the inflationary spiral would slow down for a bit (although all the workers would be worse off as they have been over the last four years in this country). But the rising capital-output ratio would soon again threaten the rate of profit, and again cause firms to raise prices; workers would then be at risk from yet another bout of inflation.
Inflation is the modern method by which capital seeks to satisfy its insatiable demand for new draughts of surplus value, so as to maintain the profitability of its ever growing quantities of old surplus value accumulated.
Secondly, the argument that it is the crisis of profitability that causes inflation does not mean that capitalists are being completely dishonest when they say they want ‘anti-inflationary’ policies providing you understand that as a policy which will stop the growth of the costs of producing goods, not the profits to be realised by selling them.
They are frightened of the wider consequences of inflation – endless wages struggles, demoralisation of their supporters within the middle classes, continually fluctuating exchange rates, bitter international competition.
To that extent the capitalist class are sincere when they claim that inflation is the greatest danger that besets them. But their sense of sincerity is heightened by the knowledge of the general ideological campaigns against ‘inflation’ serve to isolate not themselves when they raise their prices, but their workers when they push for compensatory wage increases.
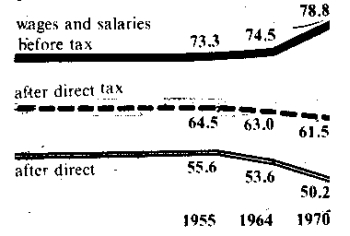
And. of course, they are always careful to build into ‘wage and prices controls’ exemption clauses designed to protect profits and investment. The very design of such policies is such as to allow price rises to protect levels of ‘real profit’, but to forbid wage rises which seek to protect levels of real living standards. The result of this in Britain can he seen from graph 3.
Finally, we can now integrate into the account some of the other factors we have mentioned in passing. The ability of firms to raise their prices in an effort to compensate for pressures on profitability does not, as we have shown, end those pressures, which re-emerge with the next turn of the inflationary spiral. Hence, they become ever more dependent on another source of funds from the government.
But the rise in government expenditure itself then threatens to cut into their profitability especially during a crisis, when government expenditure is in any case rising because of the need to stop the reserve army of labour either starving or rioting. The protection of profitability demands increased government spending of a certain sort, combined with a shift in taxation from companies to wages.
But at a certain point workers react against this shift by further heightening their wage demands. It then becomes politically, as well as economically, important for the ruling class to give the impression that ‘government spending’ (understood as that limited portion of government spending that benefits workers) is to blame for the crisis and for inflation.
All this, like the argument on wages and inflation, diverts attention for the real origins of inflation: inflation is the specific response of ageing capitalism to the crisis of profitability created by the system itself, just as the demand for straight wage cuts was the response of the system in its ‘classic’ phase. As such, it will not be ended until the system is destroyed.
Last updated on 7 March 2010